Hands on Review of iNavX Marine Navigation for iOS
The iNavX marine charting app is targeted for recreational boaters. This app allows navigation using NOAA raster charts and a few other proprietary vector and raster chart formats. Users can create waypoints & routes and also record tracks.
Routes and waypoints can be can be exported using GPX and KML file formats. These routes and waypoints can be very easily imported and exported through a separately purchased X-Traverse account. The app will function as a chart plotter, displaying the GPS position on the chart. The app is also useful for live navigation while underway using the compass tape and CDI across the top of the screen. Using additional hardware, other parameters from the boat such as depth, sailing instruments, and AIS targets can display along with the chart.
Devices
iNavX is a universal app. It can be installed on the iPhone, iPad and iPod Touch. It runs the full resolution of the iPad. It’s important to point out that WiFi only iPad’s and the iPod Touch do not have an internal GPS chip. These devices can run iNavX, but the position will not display on the chart. Third party hardware can be added to non-GPS iOS devices that will allow your position to display on the chart.
The Chart Catalog
The primary charts used with iNavX are the NOAA raster BSB charts, available as a free download from the NOAA website. If the iOS device is connected to the internet using either 3G or WiFi, iNavX will automatically go to the NOAA website and download a chart for the current GPS position. This allows the app to keep the charts very up to date, as it’s always downloading the very latest chart from NOAA. At one time, this app alone accounted for 1/3 of the entire download bandwidth of NOAA chart downloads! When using a non-3G enabled device such as a WiFi only iPad or iPod Touch, the charts can download in advance using WiFi. This is the recommended practice even for 3G enabled devices, as 3G coverage on the water can be spotty and unreliable.
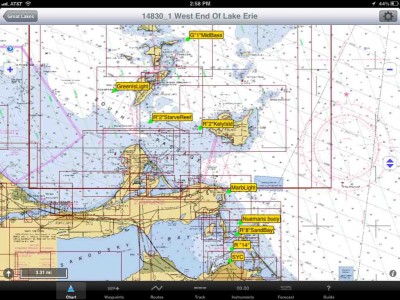
The NOAA raster BSB charts will appear very familiar to navigators that have used NOAA paper charts. They are essentially a scan of the official NOAA paper charts, that includes position data to orient the chart to the GPS.
iNavX is able to display other proprietary formats including both raster and vector charts. The following is the current list of available charts in iNavX: NOAA U.S. Marine Raster Charts, Blue Latitude Marine Raster Charts, Brazil Marine Master Charts, Canadian (CHS) Marine Raster Charts, Hilton’s Fishing Charts, Maptech US Rivers Raster Charts, Navionics Gold Marine Charts, Navionics Hot Maps, Navionics Fish’N’Chip, NV. Verlag Marine Raster Charts, Solteknik Marine Raster Charts, Trakmaps Canadian Lake Raster Maps.
The alternative chart catalogs, do not come included with the app; only the NOAA raster BSB charts are included for free. The other charts must be purchased separately through an X-Traverse Account. Please note that NOAA ENC vector charts are not on that list. Currently NOAA ENC vector charts will not view in iNavX. Users that purchase the Navionics iOS app can not use the Navionics charts in iNavX. To use Navionics vector charts in iNavX, they must be purchased separately through an X-Traverse account. This review will focus only on the NOAA raster BSB charts that are a free download.
User Interface
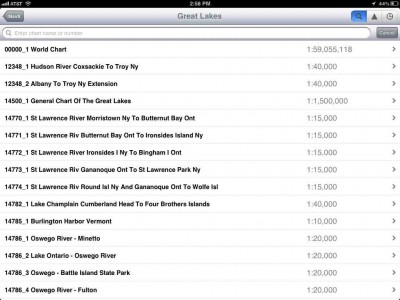
The UI is relatively easy to use, although it does have a few eccentricities that can get frustrating. When first starting up, iNavX offers a menu that indicates various regions of the U.S. based on the NOAA chart number. These regions match up exactly with the NOAA paper chart numbering system. At this point there is also an option to “Add More Charts” if the user wishes to add any of the proprietary charts purchased through an X-Traverse account.
After choosing one of the NOAA regions, a menu of all the NOAA charts in that region is presented. In the upper right corner of the screen are three buttons: a magnifying glass, a triangle, and a clock. Selecting the magnifying glass shows the chart list numerically by the NOAA chart number. A field is available that allows the user to type a search term. This will search the titles of the NOAA charts only. It will not search any POI data or reference any geographic features displayed on any raster chart. Selecting the triangle, will look at the current GPS position of the device and select only charts that are available at that position. Selecting the clock displays the last charts viewed. They are listed in the order they were used, starting first with the last chart viewed.
The first time a chart is selected, a dialog box pops up that asks if the user wants to download that chart only, or all the charts in the region. Keep in mind that if all the charts in the region are downloaded, this is going to take a significant amount of time to download, as well as a good deal of space on the iOS device and download bandwidth.
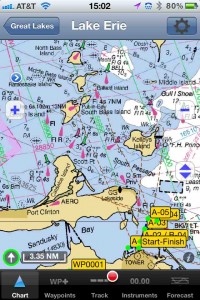
Once a chart is selected, then the user is brought to the chart plotter screen. Next comes a lesson in zooming and scaling. Since iNavX uses raster charts, it is critical to understand the difference between zooming and scaling. Raster charts are not zoomed the same way vector charts are zoomed. The standard iOS pinch to zoom technique will zoom and pan around the selected raster chart. All the information on the chart will get bigger and smaller when zooming in and out. Just as if you are bringing a paper chart closer to your face or further from your face. To change the amount of detail, then a new chart must be selected that is a different chart scale. Using the Plus and Minus buttons allows the user to scale up or down to a different NOAA chart scale. Tapping the plus or minus buttons will bring up a list of available charts. If there are no other charts available, then a window pops up informing the user: “Best Chart Displayed.”
When displaying a raster chart, all the labels on the chart will not re-orient themselves to the screen orientation. When displaying a chart in course up, then it’s possible for the labels to be sideways or upside down depending upon the course. The vast majority of NOAA raster BSB charts (and paper charts) are North up in their orientation. However, there are a few coastal charts that are not North Up. So even keeping the chart on a North Up Orientation may not keep the labels reading properly.
There is a row of buttons across the bottom allows the user to select various functions included with the app: Chart, Waypoints, Routes, Track, Instruments, Forecast, and Guide.
Waypoints
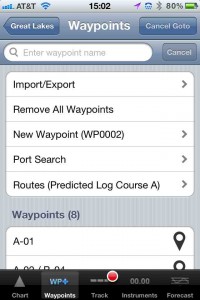
At the Waypoint screen, the user is presented with menus that allow the import and export of Waypoints, an option to remove all the waypoints, create a new waypoint, port search, and then a list of all the user waypoints stored in the app.
The import/export menus are very self explanatory. They allow the user to easily import/export waypoints from a paid X-Traverse account. They also allow the user to export waypoints as a GPX and KML file attachment to an email. The user can export waypoints to other apps installed on the iOS device. For example, I was able to use the app to export the waypoints as a KML file (but not GPX) into Dropbox. However, it is not possible to import waypoints or routes from Dropbox into iNavX. Routes can also be exported to X-Traverse, and also as an email attachment as a GPX and KML file. Strangely, routes cannot be exported to other apps such as Dropbox. No waypoints or routes can import from any other method, other than a paid X-Traverse account. While not a direct feature in the iNavX app, the iOS mail client will allow GPX and KML file attachments to open into iNavX. Once iNavX opens the file attachment, the waypoints and routes are saved into iNavX.
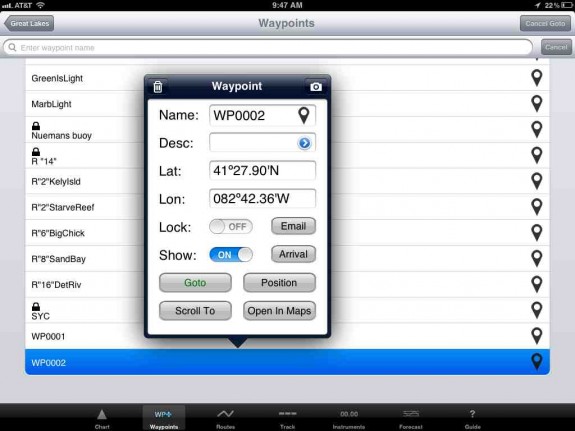
The New Waypoint button immediately brings up a screen that allows the entering of a new waypoint. The name can be edited, along with a longer description. Lat/Lon can be input and there is a lock switch. When the lock switch is set on, none of the waypoint information can be edited until the lock switch is turned back off. I really like this feature, as it prevents you from inadvertently moving a waypoint position. On the Chart Screen, unlocked waypoints can be easily dragged around the screen if they are not locked. This can easily happen inadvertently while doing pinch to zoom or panning the chart, so it’s important to keep all waypoints locked all the time. Pushing the “Scroll To” button brings up the chart screen with the waypoint indicated in the center. Pushing the “Open in Maps” button brings up a google maps view with a pushpin indicating the waypoint position. Either map or satellite view can be selected. A geotagged photo can also be added to the waypoint; either taken live with iNavX, or added from the photo library. Touching any of the existing user waypoints from the waypoints menu will bring up the same screen that allows the waypoint to be locked, edited, or a photo added.
The Port Search is an interesting function. It allows the user to search the POI’s in a raster chart. According to iNavX help guide, it is not available for all charts. I was able to use it to find particular navaids on a Lake Erie Chart and also a chart in Southwest Florida. The function would find navaids, but no other data such as Marina’s. I am not certain how many NOAA charts allow this function to work.
Going back to the chart screen can be slightly confusing. There is almost always a back button in the upper left corner of the screen. The user may or may not want to hit that button depending upon where they are in the menu structure. If they are in the import/export screen, then you want to hit the back button to get back to the waypoint menu. At the waypoint menu, another back button is at the top of the screen, but you don’t want to hit the back button at this time to get back to the chart. That back button will take you back to the main chart selection menu. You need to go down to the lower part of the screen and choose Chart from the buttons at the bottom. Quite a few times I accidentally went back to the chart selection menu and then had to re-select the chart I was viewing with a few extra screen taps. It’s slightly awkward.
Routes
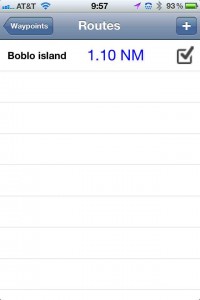
On the iPad, there is a routes button across the bottom of the screen. On the iPhone version there is not enough room at the bottom, so routes are on the Waypoint menu. This is where the UI continues to be awkward. To create a new waypoint, the user pushes the menu item to create a new waypoint. To create a new route, no such menu item exists. Instead there is a “plus” button in the upper right corner of the screen. I would expect both the waypoints and routes screens to be a little more consistent. There is no option to export any routes. But if you go back to the waypoints screen, you can export routes to email. Mysteriously this option is missing on the routes screen, and is inexplicably on the waypoint menu.
The routes screen brings up a list of the routes that are saved. Tapping any of the routes brings up a screen that allows editing of the routes. From this screen the user can “Scroll To” the route, which simply brings the route up on the last chart that was displayed. Or the user can “goto” the route. Once back on the Chart screen, a compass tape is added across the top with a CDI.
Tracks
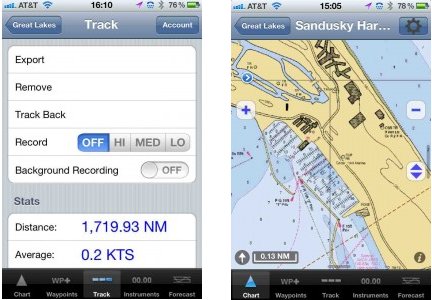
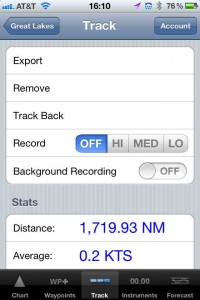
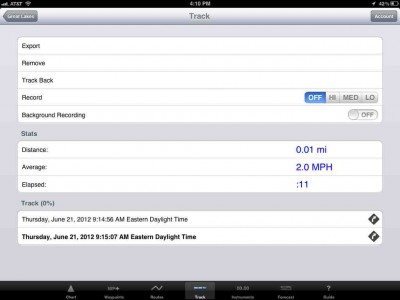
The track menu is very similar to the waypoint menu. Tracks can be exported to X-traverse, email, to Dropbox or shared on Facebook. Why would you share a track on Facebook? It’s a great way to close a float plan. If you let a few family and friends where you were going, sharing the track on Facebook is a simple way to let them all know that you arrived at your destination. Tracks can not import into iNavX. Tracks are available to record in Hi, Med, or Lo, which is the amount of points that are recorded over time. There is a switch for background recording of tracks. This will keep the app and GPS active when task switched to another app. It will keep recording the track, and will impact battery life considerably. Tracks are saved by their date and time. Names can not be assigned to the tracks.
Live Navigation
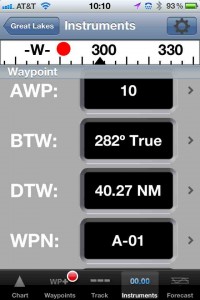
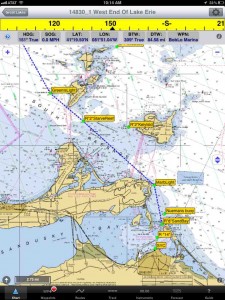
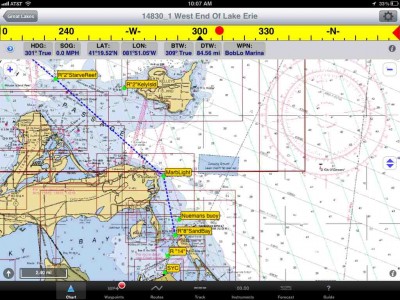
The app works very well for accomplishing live navigation. The CDI is simple to understand and to follow. There is a chevron in the upper left corner of the screen that can show or hide the compass tape and data fields. Each individual data field can be turned on or off to show only the information that the user would like to see. If other instruments are connected then the information (e.g., depth, wind speed, wind direction, etc.) is displayed. If more fields are displayed than can fit on the screen, the user can simply swipe them to the left or the right to see additional fields. There is no provision to allow two rows of the fields to be stacked. At the bottom an Instruments button can be tapped to bring up a screen that has the instrument data in a very large font. I like that the compass tape with CDI is included on this screen so that the course can be followed while checking the instruments.
Many users will enjoy using the NOAA raster BSB charts for live navigation. There is a certain satisfaction watching the same old charts that we have used for decades, slide by on the LCD screen. Personally I prefer using a vector chart, but I can completely understand users wishing to navigate with the electronic raster charts. Multiple large scale raster charts will not quilt on the display. However, a new chart is automatically selected as the user’s position moves off the edge of the current chart. The new chart is loaded very quickly. One quibble: when the position icon moves off the top of the screen, it can get under the compass tape and data fields. A new chart is not selected until the position gets to the top of the compass tape. So the compass tape and data fields hide the position icon, until it gets off the top of the screen and a new chart is selected.
Instruments and extra hardware
WiFi only iPads and iPod Touch do not have a GPS chip. So the GPS position can not display on iNavX running on one of these devices. Third party Bluetooth GPS hardware can furnish position data to the device. iNavX allows users to download charts for any area in advance, so iPod Touch and wifi only iPads are useful with iNavX.
One of the key features of iNavX is its ability to display instrumentation data on the screen. This also requires additional hardware. The first hardware required are the instruments to capture the data, such as transducers, weathervanes and anemometers. This information then needs to be converted into NMEA 0183 data sentences. Then this data needs to be pushed out to a WiFinetwork. There are a wide variety of ways to accomplish this that are outside the scope of this review, but I will briefly list a few. One way is that a laptop computer running the MacENC can take all the data from NMEA 0183 serial connection and push it up to an iPad running iNavX. Brookhouse makes a device called the iMux that can also take NMEA 0183 data and push it out to a WiFi network. The iMux is compatible with iNavX and will push all its data to the app. There are many data fields that can be pushed up to iNavX. A small sampling are: depth (from sounder), wind speed, and wind direction. If an AIS receiver is pushing data to NMEA 0183 and out the WiFi, these AIS targets can also display on iNavX. The Brookhouse iMux can also push your fixed mount plotter GPS position out to the iPad. When using a WiFi only iPad or iPod Touch, then a bluetooth GPS is not required. Also, if the iPad is down in the cabin with an obstructed view of the sky, the GPS in the iOS device will not lock and report its position. In this case, the WiFi data stream with position data from the ship’s GPS will keep the position accurate in iNavX. I was not able to test these features, as I am lacking the necessary hardware to make the connections.
iNavX Pros
- Electronic raster charts appear just like paper
- Some vector charts available for purchase
- CDI for live navigation
- Waypoints and Routes export to Dropbox and email
- Tracks export to Facebook
- AIS target display (with additional hardware)
- Instrumentation display (with additional hardware)
iNavX Cons
- Sometimes confusing user interface
- Lack of free NOAA ENC charts
- Will not share charts with other apps
Conclusions and Recommendations
Recommended. Despite a few eccentricities to the user interface, this app is especially good for navigators that are comfortable viewing the paper charts. It’s an excellent segue for those paper chart navigators into electronic charting. The raster charts load and pan very fast. The CDI is very useful when navigating a route. If the extra hardware is aboard, then having a portable and wireless display of the instruments is very valuable. Especially with the display of AIS targets. A skipper is able to allow a less experienced crew member some time at the helm, and is still able to keep an eye on lots of information from the comfort of his bunk. Sharing routes and waypoints with a paid X-Traverse account is a very simple way to keep that information “in the cloud” and sync’ed between multiple devices. The routes and waypoints could be exported and possibly used with more robust, marine GPS devices.
iNavX could be used as a standalone chart plotter. I’d like to add that no skipper should use an iPad as the sole source of navigation data in unfamiliar waters. It’s fine to use the iPad as a reference tool in familiar waters, or possibly as a back up to a more robust GPS cChart plotter. Prudent mariners should always carry paper charts and a compass and know how to use them when transiting an unfamiliar area.
Do you have any guidance on recommended minimum IPAD drive capacity for INAVX? 16, 32 or 64?
New to me. Was used succesfully last season. I looked up your site to try and re calibrate position.Used program today first time. Showed 541 ft. away.
Ships position is 541 ft. away from icon. How to reset corect position ? Capt. Jay